Over the course of this off-season (at least in the Northeast), you can expect EJ2 Track Rat to be doing some new and innovative things. For example, EJ2 Track Rat was recently featured on Garage Heroes in Trainings' Podcast.
The Garage Heroes in Training Being Garage Heroes
Well, EJ2 Track Rat has created its own YouTube channel with its first video. The video is already gaining traction as a popular video among the high performance driving and racing community.
It is entitled "5 Things You're Doing Wrong in HPDE and Track Days"
EJ2 Track Rat's First YouTube Video
When you get a chance, take a look. There's some great information on common mistakes made by drivers at all levels in the sport. Feel free to like, subscribe, and comment on the video, or leave your opinions on this blog post!
Recently, EJ2 Track Rat was featured on a podcast hosted by "Garage Heroes in Training," a group of endurance racing individuals not that different from EJ2 Track Rat.
Their goal, as is EJ2 Track Rat's, is to get people into the sport, promoting racing at a cheap cost while they currently run several cars in HPDE and LeMons. Bill, Vicki, Alan, and Jennifer are just some members of this crew.
Some of the Garage Heroes in Training Squad with Randy Pobst
Take a look at the podcast below and thanks for reading, as always:
Racing puts a lot of stress on a car. In addition to the lateral and longitudinal Gs subjecting the chassis, structural suspension components, and bushings to stress, cars get crashed, transmissions break, driveline components break, and shocks wear out. Oh yeah, and engines get abused too, I guess.
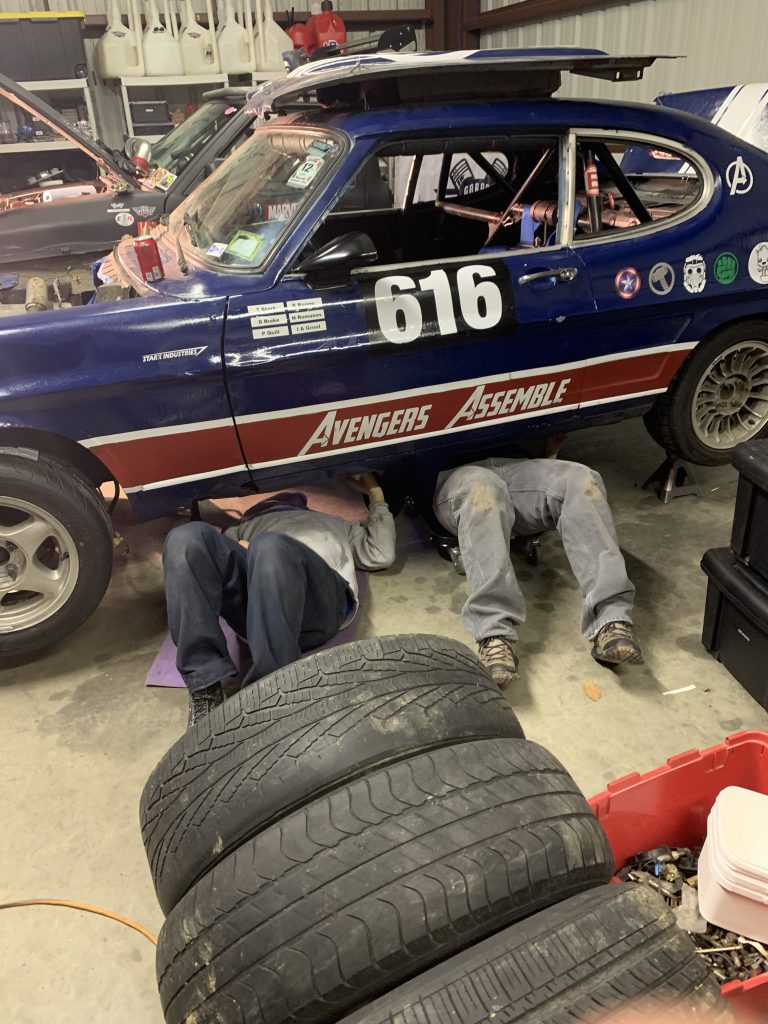
Ant working on Alex's #TrashTeg
For example:
After living in a 1998 Acura Integra for 170,000 miles, my B18B1 was transplanted into a 1993 Honda Civic DX for racing duty.
Denise the D Series Integra, Donor to Chelsea the Civic
While in the Civic, it experienced a couple of money shifts, I found some metal shavings in the oil a couple of times (not sure from where), I lost a radiator cap and pegged my coolant temperature in a qualifying session, and toward the end of this season, it began smoking more than usual, and halfway through the season, I also did a fuel pressure regulator tune which doesn't increase longevity.
The motor did still run great, getting me a podium at The 2019 NASA Champs and a win for my last race of the season. However, with all of that abuse, I figured it would be a good idea to get an overall idea of the motor's health.
Engine Bay of Chelsea the Civic
Compression Test
The first test I wanted to do on the Civic was a compression test. So, I borrowed a compression tester, and some other tools-- including a leakdown tester and an air compressor from my friend Anthony, an H2 racer, and went to town.
Ant's Car
A compression test is used to read the max pressure each cylinder can produce when the engine is cranked over. Compression tests are useful for determining the general health of the motor. Max pressures are recorded for each cylinder and then they are compared. If one cylinder is down on compression relative to the other cylinders, you know that there is a problem at this cylinder.
If you do find a cylinder low on compression relative to its siblings, it could be caused by a variety of factors. There could be a burned valve, bad ring, scored cylinder, cracked piston, cracked or warped cylinder head, or more. To figure out where to begin troubleshooting a cylinder low on compression, we do a leakdown test-- this will be discussed later in this post.
I decided to do the test on a cold motor with the cylinder "dry" and with the cylinder "wet." The definitions of a dry and wet test are shown below:
A dry compression test is done with the engine in its normal operating condition. It can be done with the engine cold or hot. I chose to do it cold due to time constraints and because I ran into some issues when trying to do it hot (the pressure gauge broke).
A wet compression test is done to see how well the oil ring is sealing between the piston and the piston wall. It is called a wet compression test because a small amount of oil is added to the cylinder and the compression test is then conducted.
While performing the dry compression test, I made a mistake while taking compression readings on cylinder #1. The connector for the pressure gauge was slightly loose and this likely threw off the reading. During analysis, I will treat this reading as an outlier and assume that the average compression for cylinder 1 is actually 155.
With this being said, two things became apparent after reviewing the data:
1.) Cylinders 2 and 3 were lower on compression than cylinders 1 and 4. Since I overheated my engine halfway through the season, it's possible that the head gasket partially failed in between cylinders, allowing for cylinder-to-cylinder leakage.
2.) Cylinder 3 was the lowest on compression of the three. While performing further diagnostics, this cylinder will receive more attention than its sibling cylinders.
The table below shows the data from this test:
Dry Compression Test on an Acura Integra B18B1 Motor with Two Race Seasons and 170k Street Miles
Wet Compression Test
Next, I performed a wet compression test. I added two caps of 5w-30 Pennzoil Platinum Synthetic Oil to cylinder one to start. After attaching my pressure gauge for the first test and cranking the motor over, it became immediately apparent that two caps of oil was too much. Wet compression at cylinder 1 came back at >300 PSI....
So, for cylinders 2, 3, and 4, I added only ONE cap of oil, using the same oil, and achieved more realistic results. After performing the wet compression test, it was apparent that cylinder 4 had the highest wet compression and cylinder 2 had the lowest wet compression. Perhaps the piston rings at cylinder 4 were in better condition than cylinders 2 and 3.
Wet Compression Test of a B18B1
After some consideration, I'm not sure that the wet compression test provides as much value as the dry compression test because there are too many variables in the test, such as:
1.) The exact amount of oil added to each cylinder (an oil cap is not most accurate way to add)
2.) Where the oil lands on top of the piston when it's injected into the cylinder
3.) When the oil is injected vs. when the compression test is taken (more time allows more oil to seep past rings)
4.) And more...
I think performing a dry test cold and a dry test hot would give a better subjective overview of how the engine is performing.
Leakdown test
As mentioned above, a leakdown test is used to determine WHY a cylinder may be down on compression relative to another cylinder. A good DIY for the beginner on this process is shown in the video below:
To do the leakdown test, I wanted the motor to be at running temperature to ensure the valves and valve seats were fully sealing inside of the cylinder. I also wanted to ensure any residual oil from the wet compression test was out of the engine.
I Ran the Civic for 15 Minutes After it Stopped Smoking
I set the air supply from my air compressor to 60 PSIG and began conducting the leakdown test, recording the leakage pressure to get a percentage leakdown for each cylinder. I did this test twice for each cylinder.
Let's take a look at the leak down percentages below:
Leakdown Percentages for a B18B1 at Running temperature
There are four test results that show nearly 100% leakby and four tests that show realistic leakby values for a motor that doesn't run like a bag of rocks. I treated the high readings as outliers because they didn't make sense for a motor that runs as well as mine does. Additionally, I've seen excessive leakby on engines where the cams were still installed in the past.
With the cams still installed, slack in the timing belt, stiction between residual oil, cams, roller-rockers, pistons, and cylinders becomes a factor in ensuring the valves fully seat when the piston is rotated to TDC. So, I took the best reading for each cylinder and used that to calculate a leakdown percentage.
Interestingly, cylinders 3 and 4 had the worst leakdown percentages of the four cylinders, but only by 2%. Recall that cylinders 1 and 4 had the highest compression readings of the four cylinders and cylinder 3 had the lowest compression reading.
To determine where the leakage is coming from, for each test, I listened to see if I could hear air hissing out of the throttle body (which would imply intake valve leakage), air leaking out of the exhaust (implying exhaust valve leakage), and air leaking out of the valve cover (which would suggest piston-to-cylinder leakby).
Below is a table showing where air leakage was heard for each successful test-- that is, I ignore the tests with erroneously high leakby values:
B18B1 Leakdown Test Observations
In all tests, it is apparent that leakage for each cylinder was due primarily to leakage between the valves and valve seats, which is to be expected from a motor with 170,000 street miles. Additionally, I did hear some air hissing out of adjacent cylinders when conducting leakdown tests on the middle cylinders-- which corroborates suspicions of head gasket failure.
Oil Analysis
Oil is used to lubricate any rotating and reciprocating components in the engine, such as the crankshaft and bearings, connecting rods and bearings, piston-to-cylinder surfaces, camshafts and journals, and roller-rocker surfaces (to name a few). Lubrication for these components is necessary because they are constantly creating friction during normal engine operation.
If adequate lubrication is not present in the engine, affected components will fail and metal bits from them will end up in the oil, in addition to other contaminants.
VTEC Valvetrains See Even More Heat and Friction Than Their Non-VTEC Counterparts
Metal isn't the only thing that shows up in engine oil when the engine is not running optimally, however. A sample may show that an engine is running too hot as evidenced by degradation of additives or carbon chains in the oil. A sample may also show that the engine has excessive blowby or incomplete combustion as evidenced by unburned fuel or sulfates and nitrates which have dissolved into the oil.
So, we sample the oil to get an additional snapshot of engine health from a different perspective.
Oil analysis isn't guaranteed to identify a failing engine. For example, a healthy running engine that experiences a brief transient where a bearing is partially wiped at the crank may have a relatively healthy oil analysis, but a large, insoluble piece of bearing may be present in the oil. This happens frequently in heavy industry with steam turbines, for example.
However, health assessments are broad and take into account many factors...we want to analyze the "big picture" and avoid relying on only one test to determine if our engine is healthy or not.
The Big Picture (A Cool and Good Stock Photo)
So, after performing my compression and leakdown test, I decided I'd send the oil to Blackstone Laboratories for analysis. Blackstone laboratories is based out of the Midwest. They will send you a sampling kit for free and all you have to do is pull a sample of oil and send it back to them.
A Blackstone Laboratories Oil Sample Kit
In the sample kit, they have a questionnaire that asks about the car's use, any important info like engine swaps or mods, and the age/mileage on the oil. They have experience analyzing many types of cars from daily drivers to race cars. They even have experience in analyzing hydraulic fluid or fluid from industrial machinery.
Within two weeks, I had my oil drained, collected, mailed, and sampled by Blackstone. Their analysis stated that my motor was in healthy condition with wear parameters below or in-line with expected values for most motors similar to mine. Take a look at the results below:
Blackstone-Provided Comments on Engine Health
They provide an extensive data sheet showing wear particles found in the oil with average values for comparison purposes. The table below shows this:
Elements Found in Oil
Lastly, they provide a table on values such as percentage anti-freeze and viscosity of the oil:
Additional Oil Information
Conclusion
After discussing results from the tests above with champion level racing drivers and builders in the amateur motorsports community and after analyzing the results on my own accord, it became apparent that the motor was in good health.
Wear material in the oil was low, suggesting the engine did not have significant degradation due to a lack of lubrication anywhere in the rotating/reciprocating assembly. Leakdown wasn't exceptionally high, and any leakdown present in the engine was most likely due to valve-to-seat leakage, and not bottom end leakage which would require an extensive rebuild.
The head gasket was a likely contributor for high leakdown % on cylinder 3 and also for lower compression numbers on cylinders 2 and 3. This was likely the result of damage from pegging my coolant gauge high during a qualifying session at the beginning of the season in 2019 at NJMP Thunderbolt.
Overall my B18B1 is in good condition. I know that I can likely run this motor for another season with no issues. This knowledge will allow me to focus my efforts on other upgrades to improve the car's speed, such as suspension and brakes.
Thanks all for reading. I hope this post was informative and interesting.
The Integra
and Civic chassis that Honda produced from the late eighties to the early 2000s
were set apart from average FWD cars because they could handle well out of the
box. With modification, they could handle even better.
One common
problem with FWD cars is understeer. Because the front wheels are doing
the accelerating, turning, and the majority of stopping, the tires tend to
"fall off" sooner than their RWD counterparts. To combat this,
FWD race car builders increase the chassis frequency, or "stiffness,"
of the rear of the car using sway bars or stiffer springs.
In this
post, readers will see how EJ2 Track Rat was able to create a low-budget
solution for drivers looking to increase rear roll stiffness via use of a stiffer
sway bar in the rear of the car.
Background
Alex's
TrashTeg was driving fairly well. He was able to pass competition school
with NASA Northeast in it and he learned a fair amount about racecraft during
the course of the season. He was also having a ton of fun. However,
Alex was beginning to realize the limits of his budget-built car-- Partially
because his car had too much dive, squat, and roll under braking, acceleration,
and cornering, respectively.
When
TrashTeg was first built, it had the following setup:
205 Toyo RRs
At a ride height of ~5.5-6 inches
With a front spring rate of 650 pounds/inch,
Rear spring rate of 750 pounds/inch,
No front sway bar,
A 25 mm GodSpeed (eBay) rear sway bar,
And some Koni Sports he got for free from our friend
Anthony
Our goal was
to increase the roll stiffness of the car while still keeping the car
controllable at the limits with a healthy amount of rotation in corners.
We had two options: increase front and rear spring rate, with a stiffer rear
spring rate than front, or increase front spring rate and throw a big rear bar
on.
Since I only had a pair of 800 pound/inch springs in my garage, we figured we'd
throw the 800 pound/inch springs up front, and increase rear roll
stiffness without springs. The easiest way to do this is with a bigger sway bar, which
A-Spec Racing (ASR) makes. Their 32 mm hollow bars come in different
thicknesses and since they're hollow, they have the advantage of less weight
vs. their solid counterparts for the same amount of torsional resistance.
ASR Hollow Rear Sway Bar Kit
However, ASR
bars are not cheap at ~$500 for a full kit and Alex had already purchased a
$300 eBay sway bar kit. He wasn't about to spend $500 more for the ASR
product as a result. But, he and I were both interested in doing
something creative.
Much debate
was had on this thread-- specifically whether one can weld to a sway bar and
expect it to work because sway bars go through a forging process that allows
them to become "spring steel." Spring steel is highly
malleable, but returns to the shape it was bent from fairly easily.
Welding to spring steel changes that property and increases brittleness.
Example of a Cracked Sway Bar (Not Ours)
Doing the Deed
Since we don't care about armchair engineers and we buy parts for our
destined-for-doom race cars on eBay, we decided it'd be worth a go to attempt
something similar. The new setup would have the following changes:
Ride height lowered to 5" at pinch welds
Front spring increased to 800 pounds per inch
A "custom" xxx mm solid rear sway bar, courtesy of
the plumbing aisle at Home Depot
We started by purchasing some steel black tubing with an inner diameter of 1" and a wall thickness of 0.133" for about $20. A 1" inner diameter equates to 25.4 mm which is only slightly larger than the OD of our eBay sway bar. Our plan was to cut this bar to length so that it would fit between the pillowblocks that mount the sway bar to the subframe. Then, we would cut the bar in half, length-wise, and weld half of the Home Depot pipe to the sway bar. This would result in a solid sway bar with a diameter of ~28 mm.
Sway Bar Diagram from ASR
Our Plan from EJ2 Track Rat
We laid out the eBay sway bar after purchasing the pipe from Home Depot and we started by measuring where our addition would be and how short we'd need it cut.
Laying Out the Sway Bar
Next, we cut our Home Depot pipe to length using a cut-off wheel. Ideally this would be done with a band saw, but with a pipe-vise it's easy to do with a $30 Harbor Freight cut-off wheel. The cut just isn't as clean.
Alex Cutting Home Depot Pipe to Length
Next we cut the pipe in half, lengthwise using our cut-off wheel and our old school bench vise from eBay.
Cutting the Home Depot Pipe in Half Length-Wise
To weld our cut-off half of the Home Depot pipe to our eBay sway bar, we would need to first clamp the OD of the Home Depot bar to the sway bar. After grinding the surface of the Home Depot pipe and the sway bar clean, we clamped the Home Depot bar to the sway bar using a set of Milwaukee vise grips.
Half of a Home Depot Pipe Clamped to an eBay Sway Bar
I ran a bead across a section to the left and right of the vise grip, then moved the vise grip down the length of the sway bar and repeated the process...the entire thing was done with flux wire.
Close-up of Beads Ran Next to Vise Grip
The entire bar welded up looked amusing, to say the least. It really was also great practice for welding. I needed some, so this was of benefit to me.
Picture 1 of Welded Sway
And Picture 2...
Finally, we sprayed the bar gloss black and mounted it onto the car. Once on the car, we checked to ensure clearance between our modified bar and the subframe brace was satisfactory.
The Bar Mounted to the Subframe
Checking Fit with Bar at Full Droop
Checking Fit with Bar at Full Compression
And after installing the rear bar, we installed my front springs and manually set ride height as we always do-- the LoBuk way.
Alex Setting Ride Height to Clock Bushings
Another View of Alex Setting Ride Height to Clock Bushings
Impressions
Alex tested TrashTeg at Watkins Glen in October of 2019 with NASA NE to see how the changes improved the car.
Alex Suiting up for a Race at The Glen
On Track, he noticed sharper turn-in due to the stiffer front springs, but the larger rear sway also allowed the car to have less mid-corner push. The new sway bar we created held up for a full weekend of abuse at one of the best and most demanding tracks in the Northeast.
After our racing shenanigans on Saturday we attended a NASA Northeast BBQ and had a good time. The car held up, the mods made it faster, and we had a great time.
Racing is a data-driven sport. Regardless of the money or car you have, it's possible to make educated decisions on setup changes or tweaks to driving style by using hard work and commitment. However, without understanding the craft of data analysis, hard work and commitment can often lead to dead ends.
Burning the Midnight Oil with Crew Members Kelley and Andrew at 2019 NASA Championships
In this article, EJ2 Track Rat will show readers how "free" lap analyses from RaceHero can be used to go faster in a race.
RaceHero Logo
How it Works
RaceHero is a free service that shows the provisional lap times, positions, and announcements for races and time trial events with many organizations such as the National Auto Sport Association (NASA) or the Sports Car Club of America (SCCA).
Racers or high performance drivers put a transponder on their car and their racing info is transmitted to this website for the sake of reviewing provisional results. While the data on RaceHero is not official data used for prizes or points, it is extremely useful since racers can see their own data and and their competitors' data.
Overall Position on Y-Axis, Lap Times on X-Axis
Fast Lap Times
Throughout the weekend, I was keeping an eye on my lap times relative to my competitors'. I was up against some stiff competition from the West Coast including National Champion, Robert Krider and his teammate, Keith Kramer of Double Nickel Nine, as well as my good friend Carlos Valenzuela and Steve Peterson of Team Beans and Dog Racing.
These Guys Mean Business!
During practice on the first day, with the help of my Crew Chief, Andrew, I made changes to the car after every session. I did not run my transponder for the first two sessions of five, but I did run it for the third, fourth and fifth sessions. During the third session, I was about 1.5 seconds off of the leader, Robert Krider with a best lap time of 1:46.882 vs. his 1:45.338.
Results from Session 3 Practice
By the end of the day, Krider had improved by ~0.3 seconds relative to my times. This suggests my competitor was able to make a significant change to the car's performance or to his driving style which would make my job harder for the weekend. Regardless, this analysis prepares one to look for more time in more places-- i.e. work harder.
For the first qualifying session, Team Beans and Dog switched drivers from Steve to Carlos and laid down a flyer. Of note, additionally, was the overall drop in lap times for all competitors, suggesting that the track was "getting faster," providing more grip for drivers. This is due to cloud cover, ambient temperature, and humidity per experience.
As the day went on, track conditions became further quick as suggested by another overall drop in lap times. While I wasn't gaining significant ground on the leader for qualifying, I was maintaining a steady deficit utilizing car changes to keep up with a stacked racing team. In Qualifying #2, again, I was in 4th, but the results were slightly different, running my fastest lap thus far.
Race Analysis
There were two races during the Championship Weekend-- one was a qualifying race and one was the main event for the podium.
Standing in 3rd on the Podium Against Reigning National Champ team Double Nickel Nine
During a race, the fastest lap time matters, but what matters more? The sum of the following matters more:
1.) Traffic management
Managing faster or slower, out-of-class cars passing without significant loss in speed/position are facets of good traffic management.
2.) A good start
Avoiding jumping the start which would result in disqualification, having impeccable reaction time when the flag drops, and deciding when to pass or bump help for a good start.
3.) Car/driver consistency
If the driver cannot maintain their level of performance throughout a race due to a lack of cardio or mental conditioning, they will fall off in speed. If the car is not set up to make the tires "happy," the car will fall off in speed. A combination of the two is key.
4.) Flag management
You can be leading a 45-minute race for the entire time. But if you pass just once under a yellow, you will be disqualified.
5.) Defense
How to stop a faster in-class car from getting around you.
6.) Offense
How to pass an in-class car from behind and make it stick.
RaceHero can be used to measure all of these things-- whether one at a time, or collectively. For example, a good start would be suggested in part by a good lap time for the first lap relative to competitors or a large gain in position. Car/driver consistency can be gauged by a drop or lack thereof in lap times over the course of the race. A defending driver may maintain position in front of an in-class car with a faster best lap time.
Photo of #ChelseaTheCivic Leaving the Keyhole at Mid-O (Photo by Herb Lopez of @DriveNASA
For race analysis, I typically take all of the RaceHero data I can get for my competitors and put it into an Excel Sheet like a true engineer would. Below you will see that I copied all lap times from RaceHero, converted them to total seconds to make it easier for Excel to analyze, then I measured standard deviation of hot, green laps (not first or last lap...no standing yellow laps) and put it in a table:
Getting my Data Nerd on
For the first lap, it's clear that I had a very good start. I decided to bump Kramer whose start was not as good to keep Steve on my inside while Ken had the best start of all of us, getting the jump on Keith, Steve, and myself to second place.
However, leading into China Beach, Ken was passed back by both Keith and I with Steve still in tow of Ken. The rest of the first lap was a game of traffic management. All of these factors lead me to the second-fastest first lap time. However, with nearly a 20-HP deficit to my competitor Krider, a better time would have been difficult to achieve:
Starting Lap Times
Next, we'll look at the beginning laps of the race. In the beginning laps of the race, it's important to play offense, attempting passes on your competitors while the tires are still fresh. It's also important to get by slower out-of-class traffic as quickly as possible. During this portion of the race, heart rate and adrenal release should be highest.
Photo by Herb Lopez of @DriveNASA
Below you'll see a graph of overall lap time in seconds vs lap # for Steve, P4 and myself, P3. For the first half of the race I laid down a killer start and close to the fastest lap I could for my second lap. After that, variation in lap time was caused by out-of-class traffic. However my good start allowed me to maintain a comfortable lead:
Analysis of Race Start
In the middle of the race, I try to conserve my tires as best as possible so I can lay down flyers at the end of the race. This is also clearly noticeable in the next graph I'll show below. What's important to remember is while you're saving your tires, your competitor in the spot behind you may be catching up. This was exactly the case as Steve, in his lightweight CRX began to close the gap:
Mid-Race Analysis
By the end of the race, one may note that Steve and I were running very close times. Keen eyes will also observe that Steve's fastest overall lap time was somewhere near 1 second faster than my fastest overall lap time, suggesting this driver/car combo had more speed than I. This makes sense because by the end of the race I was driving as defensively as I could within racing rules. It's important to avoid blocking or other foul play when employing proper defense, but it's also important to maintain position, obviously.
End-of-Race Analysis
Driver and car consistency among the pack will lastly be analyzed. To do this, we look at standard deviation and average lap time per competitor. Any laps with yellow flags, red flags, restarts, and aborted starts are thrown out. Additionally, we do not consider starting and finishing lap from RaceHero when calculating these statistics.
Since this is averaged over the entire race, this heavily favors analysis of driver consistency over car consistency. Car consistency is better analyzed in segments as shown above. However, car consistency is a variable feeding into this analysis.
Overall Race and Consistency Analysis
As shown above, Steve and I had the best consistency over the course of the race (+/- 0.80 and +/- 0.69, respectively). We had an awesome, clean battle that ended up with me in P3 and Steve in P4. The race video is here:
Champ Race Highlights
Thanks for the read, all. Looking forward to my next blog post.