
Introduction
In my last post, I discussed the first upgrade for my budget transmission-- moving from a helical limited slip differential to a clutch-type differential. If you didn't read that yet, I suggest you go back and take a look.

A pic from my Instagram of Damien and I at New Jersey Motorsports Park (Photo by Windshadow)
The second of two transmission modifications allowed in the National Auto Sport Association's (NASA) Honda Challenge H4 class is a final drive gear with a different gear ratio from stock.
So, what does a final drive do? In this post, we'll delve a little into that and we'll discuss how you should choose one for the road course.
What is a Final Drive?
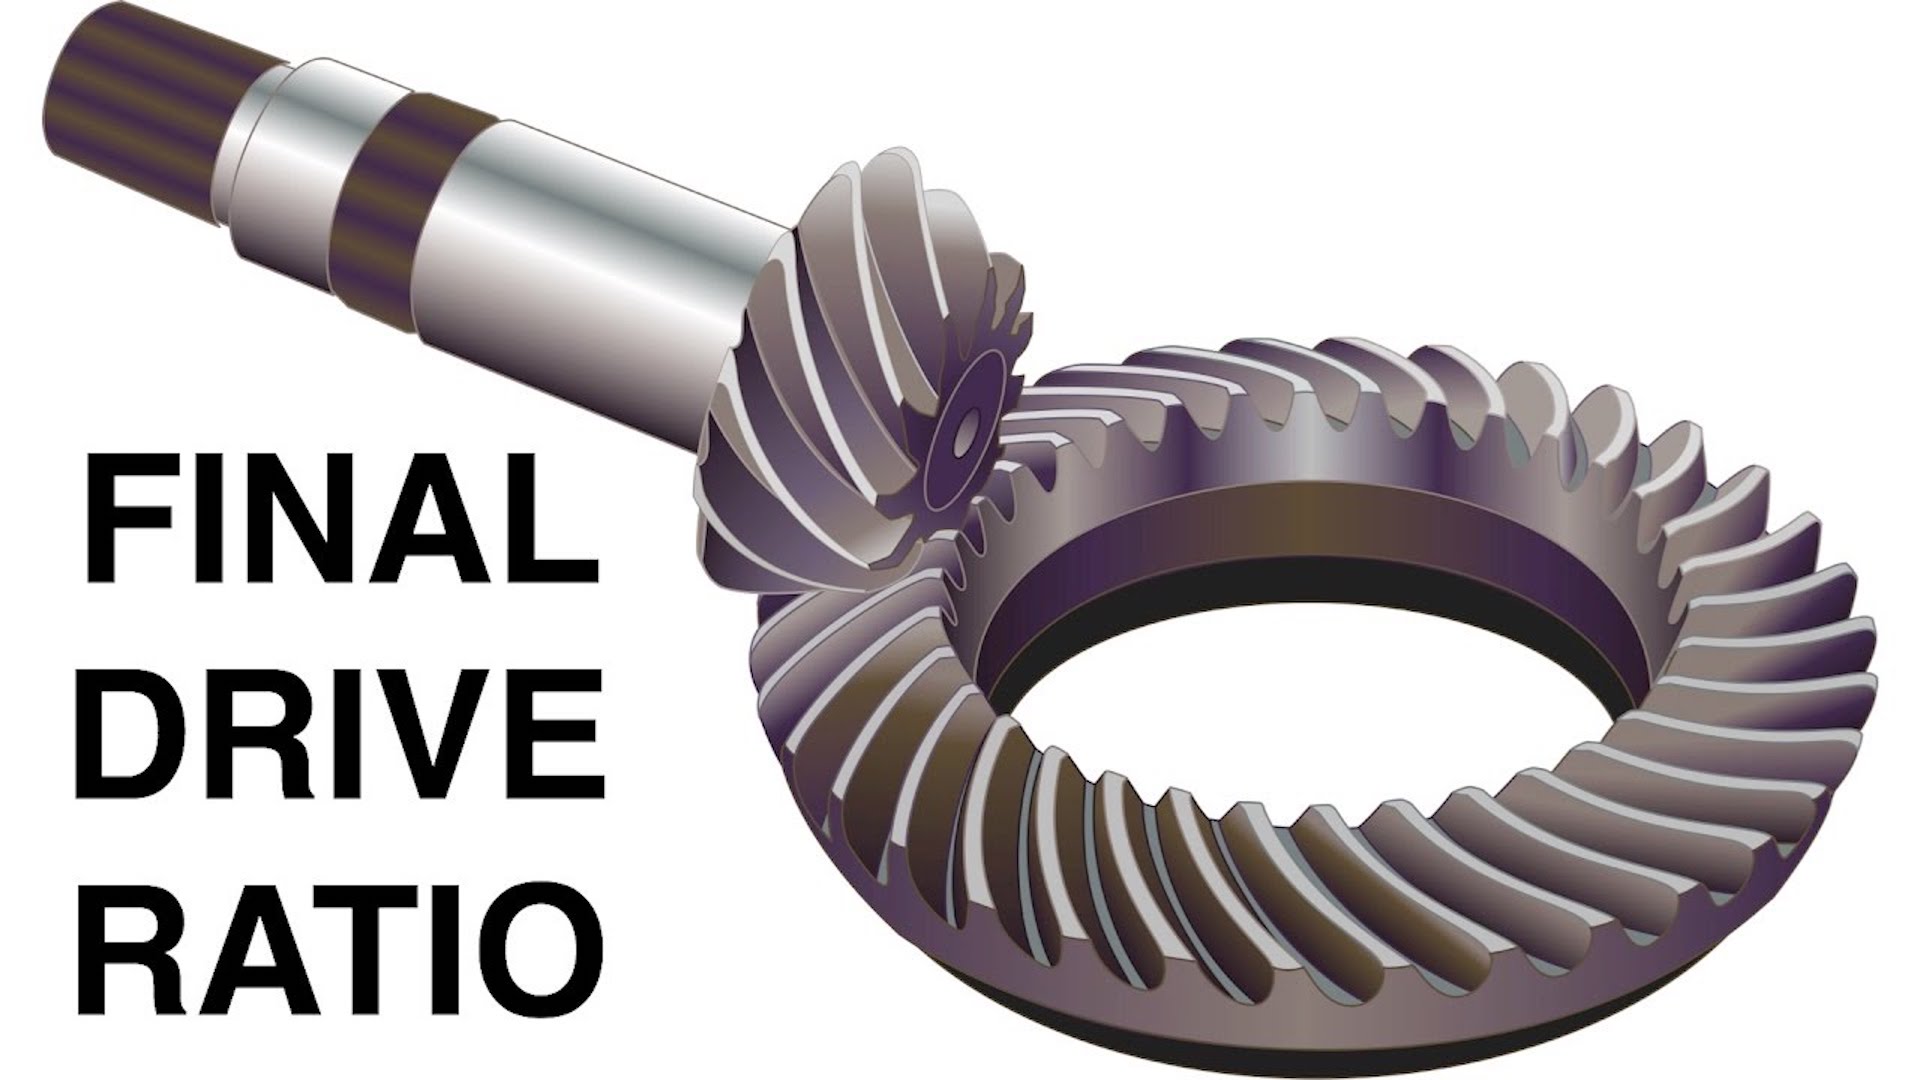
The final drive is basically the last gear between the transmission and the drive axles. By altering the final drive gear ratio, you alter the amount of wheel rotations per rotation of the selected gear.
So, a 4.2:1 final drive will rotate the driven wheels 4.2 times for each rotation from the transmission and a 4.7:1 final drive will rotate the driven wheels 4.7 times for each rotation from the transmission.
If we select a "shorter" final drive, we are saying we want a final drive with more rotations at the wheels per rotation at the gear. This gives us more torque at the wheels and more acceleration, which we gain in return for a loss in top speed. We call this a "shorter" final drive because the amount of time between gear shifts is now not as long as it once was.

2 Fast...
On the flip side, if we choose a "longer" final drive, we are trading straight line torque and acceleration for top speed and a potential gain in fuel economy. The longer final drive gives less rotations at the wheel per rotation in the selected gear. It takes more time between shifts, so we call it "long."
Why Should I Change My Final Drive?
In a drag racing car, we can go faster by turbocharging our cars or modifying the engines to generate more torque and horsepower.
However, if the stock final drive is too short, one disadvantage is a loss of top speed.
If the stock final drive is too long, one disadvantage is a loss of torque at the wheels.
So, drag racers must find the proper balance between torque to the wheels and top speed by selecting the correct final drive. Many other factors play a role in this phenomenon, but they're beyond the scope of this article.

A Camaro at the strip
In road racing cars, the sessions are typically longer, the tracks have corners and elevation changes, and horsepower isn't as important as cornering speed in most amateur classes.
So, to go faster we can't rely on adding power at the cost of reliability, choose a final drive that will give us the best straight line speed, or choose the final drive with the best acceleration. We must consider other factors.

Ken, Kallie, and Brian at New Jersey (Photo by Windshadow)
How to Choose a Final Drive
There are five steps outlined in this article for choosing a final drive.
Step 1: Find the Powerband
Step 2: Find your Corner Speeds
Step 3: Compare Final Drives for Each Corner for Each Track
Step 4: Repeat Step 3
Step 5: Test
Step 1: Find the Powerband
Let's take a look at the stock, 94-01 Acura Integra LS/RS/GS-- a popular Honda for road racing due to its suspension geometry and operating costs.
 The stock Integra that loaned its motor to my race car
The powerband for a car is a colloquial term which refers to the engine's RPM range at which it operates most efficiently. If you're low on money and have a relatively stock motor and no dyno sheet, a great way to find your car's powerband is through the internet.
Wikipedia states that the stock 1998 Acura Integra generates peak torque at 5,200 RPM and peak power at 6,300 RPM. So, we will conservatively assume that the powerband is from ~5,000 to ~6,500 RPM, allowing for shifting inaccuracy and any changes in engine efficiency due to age and use.

So, we know where the car's RPMs need to be to remain happy, but how do we apply this to the track? You may be racing Summit Motorsports Park Main with a 0.55-mile-long straight or Lime Rock Park which is a Miata track. You may be racing somewhere with anywhere from ten to twenty-five corners, all with different average speeds and elevations.
Some corners are extremely important and can lose races if the car and driver are not fast through them and out of them-- like Turn 1 at Watkins Glen. Some corners are not important at all and are referred to as "throw-away corners,"
So what do we do?
 Turn 1 at Watkins Glen International Raceway
Step 2: Find Your Corner Speed
Disclaimer: This is where we must analyze our cornering speeds-- it is an art and our conclusions may not always be the same. However, i'm going to do my best to break it down so you can make your own decisions in the end. The most important thing is that you trust your gut and supplement that with real-world data.
Using an AiM Solo or an equivalent lap timer, take a look at all of the tracks you race in a typical season in your area. For each track there will be several key corners where exit speed is critical because momentum is lost. For example, below you'll find a trace of one of my fast laps at NJMP Thunderbolt last year with a 4.2 final drive:
 Data from an AiM Solo
There are three graphs drawn versus track distance in the above figure. In order from top to bottom they are: lateral G's, longitudinal G's, and speed. We use the longitudinal G and lateral G graph as a reference point and the speed trace to see what our corner speeds are.
In this figure, I have highlighted several corners where a lot of momentum is lost due to braking which is required to make the tight-radius corners. Those corners are 1, 2, 5, 7, and the exit of the octopus. Below you'll find a track map and video for reference:
 NJMP Track Map

 Zeal Autoworks Transmission Speed Calculator...Stock 4.266:1 Final Drive in an Integra
The screenshot above shows the max MPH for each gear using a stock 4.266 final drive in an Acura Integra. Using this calculator, we can also get the values for a transmission with a different final drive. For our example, we'll look at a comparison between a stock 4.2:1 and an aftermarket 4.7:1 final drive. Trans 1 uses a 4.2:1 final drive and Trans 2 uses a 4.7:1 final drive:

We can see that the RPM increases much quicker for a given change in speed with the 4.7:1 when compared to the 4.2:1. However, you'll also note that the top speed in 5th gear is much lower with a 4.7:1 final drive than it is with a 4.2:1. This reinforces what we stated above, that a longer final drive has less acceleration ability, but a higher top speed, and vise-versa.
Now, we know the corners we want to optimize our car's final drive for, we know the minimum speed through the corners, and we know the power band for our car. All that's left is to compare graphs of RPM vs. speed for different final drive ratios to find the most optimal for your car. For the sake of simplicity, we'll analyze the comparison between a 4.2:1 and 4.7:1 transmission further.
 Dame and I going at it at Lime Rock Park
Below you'll see the graph we looked at previously, but this time I've overlaid two y-axis lines and several x-axis lines. The y-axis lines are in red and they represent the powerband and the x-axis lines are the minimum speeds for the corners we deemed most important at NJMP Thunderbolt.
 Overlaying pertinent powerband and track corner speed data on the RPM vs speed trace for different transmission gearing
Corner by corner, let's look at what the data tells us...
Step 3a: Compare Final Drives-- Corner by Corner Analysis
In this next sub-step, we will go through each of the corners we deemed most important and select the final drive ratio that benefits us most.
Turns 1 and 2:
Below is a graph of RPM vs speed for a transmission with a 4.2 final drive and a 4.7 final drive. We can see that when proceeding through Turns 1 and 2 in a 4.7:1 final drive transmission, we have two options for gear choice:
We can stay in fourth gear through turn 1 and keep our feet to the floor as we progress through turn 2, minimizing brake input. Or, we can keep the car in 3rd, turn into corner #1, and shift into 4th out of turn 2. Either way, we need to row through the gears to optimize mid-corner to corner exit speed with the 4.7:1 final drive.
 Graph of RPM vs. speed for a transmission with a 4.2:1 final and a 4.7:1 final


If we zoom out on Turn 7 and The Octopus together we can better put things into perspective.


 Photo by Viken Photography

What is a Final Drive?
The final drive is basically the last gear between the transmission and the drive axles. By altering the final drive gear ratio, you alter the amount of wheel rotations per rotation of the selected gear.
So, a 4.2:1 final drive will rotate the driven wheels 4.2 times for each rotation from the transmission and a 4.7:1 final drive will rotate the driven wheels 4.7 times for each rotation from the transmission.
If we select a "shorter" final drive, we are saying we want a final drive with more rotations at the wheels per rotation at the gear. This gives us more torque at the wheels and more acceleration, which we gain in return for a loss in top speed. We call this a "shorter" final drive because the amount of time between gear shifts is now not as long as it once was.
2 Fast...
On the flip side, if we choose a "longer" final drive, we are trading straight line torque and acceleration for top speed and a potential gain in fuel economy. The longer final drive gives less rotations at the wheel per rotation in the selected gear. It takes more time between shifts, so we call it "long."
Why Should I Change My Final Drive?
In a drag racing car, we can go faster by turbocharging our cars or modifying the engines to generate more torque and horsepower.
However, if the stock final drive is too short, one disadvantage is a loss of top speed.
If the stock final drive is too long, one disadvantage is a loss of torque at the wheels.
So, drag racers must find the proper balance between torque to the wheels and top speed by selecting the correct final drive. Many other factors play a role in this phenomenon, but they're beyond the scope of this article.

A Camaro at the strip
In road racing cars, the sessions are typically longer, the tracks have corners and elevation changes, and horsepower isn't as important as cornering speed in most amateur classes.
So, to go faster we can't rely on adding power at the cost of reliability, choose a final drive that will give us the best straight line speed, or choose the final drive with the best acceleration. We must consider other factors.

Ken, Kallie, and Brian at New Jersey (Photo by Windshadow)
How to Choose a Final Drive
There are five steps outlined in this article for choosing a final drive.
Step 1: Find the Powerband
Step 2: Find your Corner Speeds
Step 3: Compare Final Drives for Each Corner for Each Track
Step 4: Repeat Step 3
Step 5: Test
Step 1: Find the Powerband
Let's take a look at the stock, 94-01 Acura Integra LS/RS/GS-- a popular Honda for road racing due to its suspension geometry and operating costs.

The powerband for a car is a colloquial term which refers to the engine's RPM range at which it operates most efficiently. If you're low on money and have a relatively stock motor and no dyno sheet, a great way to find your car's powerband is through the internet.
Wikipedia states that the stock 1998 Acura Integra generates peak torque at 5,200 RPM and peak power at 6,300 RPM. So, we will conservatively assume that the powerband is from ~5,000 to ~6,500 RPM, allowing for shifting inaccuracy and any changes in engine efficiency due to age and use.

Pulling a stock Integra motor from #TrashTeg
So, we know where the car's RPMs need to be to remain happy, but how do we apply this to the track? You may be racing Summit Motorsports Park Main with a 0.55-mile-long straight or Lime Rock Park which is a Miata track. You may be racing somewhere with anywhere from ten to twenty-five corners, all with different average speeds and elevations.
Some corners are extremely important and can lose races if the car and driver are not fast through them and out of them-- like Turn 1 at Watkins Glen. Some corners are not important at all and are referred to as "throw-away corners,"
So what do we do?

Step 2: Find Your Corner Speed
Disclaimer: This is where we must analyze our cornering speeds-- it is an art and our conclusions may not always be the same. However, i'm going to do my best to break it down so you can make your own decisions in the end. The most important thing is that you trust your gut and supplement that with real-world data.
Using an AiM Solo or an equivalent lap timer, take a look at all of the tracks you race in a typical season in your area. For each track there will be several key corners where exit speed is critical because momentum is lost. For example, below you'll find a trace of one of my fast laps at NJMP Thunderbolt last year with a 4.2 final drive:

There are three graphs drawn versus track distance in the above figure. In order from top to bottom they are: lateral G's, longitudinal G's, and speed. We use the longitudinal G and lateral G graph as a reference point and the speed trace to see what our corner speeds are.
In this figure, I have highlighted several corners where a lot of momentum is lost due to braking which is required to make the tight-radius corners. Those corners are 1, 2, 5, 7, and the exit of the octopus. Below you'll find a track map and video for reference:

A lap of Thunderbolt in my old single cam HPDE setup
Looking at the AiM data, we can see the following corner exit speeds for a 4.2:1 stock final drive in an H4 Acura Integra:
Approximate minimum speed per corner at NJMP Thunderbolt
Watching video and using common sense, I can look at these speeds and remember what gear I'm in while on track, which is third gear for every. single. corner! Why is this useful again?
Step 3: Compare Final Drives
The internet doesn't just have the powerband for a stock B18B1, it also has calculators that allow you to look at the RPM vs Speed trace for a stock Integra transmission. The calculator I like to use for Hondas is from Zeal Autoworks. It's been around since forums were hot and it's still in use-- so you know it's good.
You can choose the Honda transmission you're interested in and alter gear ratios as well, comparing two at a time. Tools for other cars are likely to exist on the internet as well.
The screenshot above shows the max MPH for each gear using a stock 4.266 final drive in an Acura Integra. Using this calculator, we can also get the values for a transmission with a different final drive. For our example, we'll look at a comparison between a stock 4.2:1 and an aftermarket 4.7:1 final drive. Trans 1 uses a 4.2:1 final drive and Trans 2 uses a 4.7:1 final drive:

We can see that the RPM increases much quicker for a given change in speed with the 4.7:1 when compared to the 4.2:1. However, you'll also note that the top speed in 5th gear is much lower with a 4.7:1 final drive than it is with a 4.2:1. This reinforces what we stated above, that a longer final drive has less acceleration ability, but a higher top speed, and vise-versa.
Now, we know the corners we want to optimize our car's final drive for, we know the minimum speed through the corners, and we know the power band for our car. All that's left is to compare graphs of RPM vs. speed for different final drive ratios to find the most optimal for your car. For the sake of simplicity, we'll analyze the comparison between a 4.2:1 and 4.7:1 transmission further.

Below you'll see the graph we looked at previously, but this time I've overlaid two y-axis lines and several x-axis lines. The y-axis lines are in red and they represent the powerband and the x-axis lines are the minimum speeds for the corners we deemed most important at NJMP Thunderbolt.

Corner by corner, let's look at what the data tells us...
Step 3a: Compare Final Drives-- Corner by Corner Analysis
In this next sub-step, we will go through each of the corners we deemed most important and select the final drive ratio that benefits us most.
Turns 1 and 2:
Below is a graph of RPM vs speed for a transmission with a 4.2 final drive and a 4.7 final drive. We can see that when proceeding through Turns 1 and 2 in a 4.7:1 final drive transmission, we have two options for gear choice:
We can stay in fourth gear through turn 1 and keep our feet to the floor as we progress through turn 2, minimizing brake input. Or, we can keep the car in 3rd, turn into corner #1, and shift into 4th out of turn 2. Either way, we need to row through the gears to optimize mid-corner to corner exit speed with the 4.7:1 final drive.

Yet if you look at the green line in the above graph, you'll see that through turn 1, you can maintain 3rd gear, through turn 2 you can maintain 3rd gear, and once through turn 2, onto the back straight, you can shift into 4th all while staying in the powerband.
This implies that a 4.2:1 final drive is most advantageous for turns 1 and 2.
Turn 5:
The next corner we'll analyze is the slow left-hander out of the high-speed, sweeping right-hander at NJMP Thundebrolt-- also known as Turn 5.
Photo of Condor Speed Shop's Bimmer through what looks like Turn 5
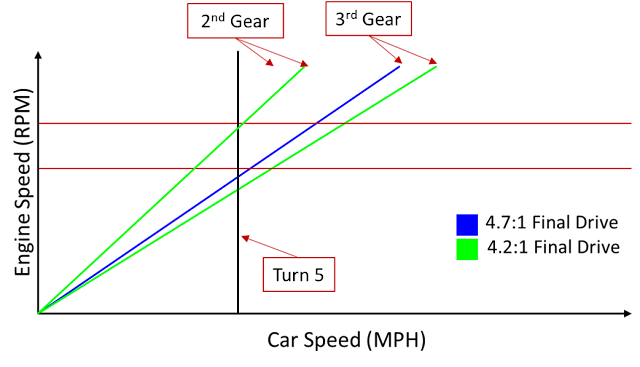
The graph shown below is similar to those above, but the x-axis line in this graph is for Turn 5.

Turn 5 min speed, stock Integra powerband RPM range, and RPM vs speed plots on one graph
Driving a 4.2:1 transmission, we have two options for gear choice-- 2nd or 3rd. In either gear, we're significantly far from the powerband while close to the minimum speed for this corner. 4.2:1 is far from optimal for this corner.
However, a 4.7:1 final drive puts us at the intersection of the powerband for our motor and the minimum speed for Turn 5 when in 3rd gear.
From this, we can conclude a 4.7:1 final drive is better for Turn 5.
Turn 7:
The second-to-last corner we'll analyze is Turn 7 at NJMP Thunderbolt. This corner is a lot of fun because it requires a lot of braking, but if you choose the proper line and throttle/brake inputs through here, passing can be completed against a fierce competitor.
Looking at the graph below, it appears that a 4.2:1 final drive would be the best from the middle to the end of turn 7 as it requires less shifting and starts at the bottom of the powerband.
Keep in mind, however, that exiting turn 7 is not a straight, but a decreasing radius right-hander that requires grip. Not all speed through this section is due to final drive selection. It could be due to other factors not covered in the scope of this article, such as driving style or differential setup.
With situations like this, it's best to rely on your experience driving the track. Feel the corner and use your intuition to gauge what would be most advantageous in the big picture. I may think this is an important corner for final drive selection, but maybe it's not! Remember what I said in the beginning disclaimer-- this is an art.
Take a look at the graph and map below:

Graph of turn 7's min speed on an RPM vs speed graph for a stock Integra with different final drives

Diagram of T7 at Thunderbolt
The Exit of the Octopus
If we zoom out on Turn 7 and The Octopus together we can better put things into perspective.

The "back half" of NJMP Thunderbolt
From the exit of The Octopus, it's easy to see that the 4.7 final drive is better positioned to exit the corner than the 4.2 final drive is. The 4.7 AND the 4.2 final drive are both in 3rd gear which means they still have a 4th gear to shift through before they reach the abysmal, long fifth gear in these cars.

Engine speed vs car speed chart for the exit of The Octopus
However, a car must be tuned within the context of the track and therefore it is an art as mentioned above. Keep in mind that after the exit of The Octopus, racers in a low-powered car will never lift until they get all the way back to Turn 1 at NJMP Thunderbolt.
This reinforces the point that tuning a car cannot focus on only one aspect-- road racing or for the drag strip...

Step 4: Repeat 3A
Using different ratios, now it's time to experiment with which one works best for your driving style for a given track. Additionally, remember to consider corner speeds for other tracks you regularly drive. Lime Rock Park and Watkins Glen may deserve two totally different final drives for example.
Step 5: Test
Lastly, get your car on the track and see if it works. Compare data using your on-track lap timer. This is an essential tool.
Conclusion
As stated above, a final drive can have a large influence in corner exit speed for a track car. While it also factors into the top speed of a track car, there are other factors to consider such as gear ratios for each individual gear and overall horsepower/torque for the car. Additionally, there are factors that will make the car corner faster, thus potentially affecting final drive choice.

Photo by Viken Photography
I'm glad you guys had a chance to stop by. Please recommend my blog and share my posts if they help you at all. See you guys next time!