Introduction
Racing is a data-driven sport. Regardless of the money or car you have, it's possible to make educated decisions on setup changes or tweaks to driving style by using hard work and commitment. However, without understanding the craft of data analysis, hard work and commitment can often lead to dead ends.

Burning the Midnight Oil with Crew Members Kelley and Andrew at 2019 NASA Championships
In this article, EJ2 Track Rat will show readers how "free" lap analyses from RaceHero can be used to go faster in a race.

RaceHero Logo
How it Works
RaceHero is a free service that shows the provisional lap times, positions, and announcements for races and time trial events with many organizations such as the National Auto Sport Association (NASA) or the Sports Car Club of America (SCCA).
Racers or high performance drivers put a transponder on their car and their racing info is transmitted to this website for the sake of reviewing provisional results. While the data on RaceHero is not official data used for prizes or points, it is extremely useful since racers can see their own data and and their competitors' data.

Overall Position on Y-Axis, Lap Times on X-Axis
Fast Lap Times
Throughout the weekend, I was keeping an eye on my lap times relative to my competitors'. I was up against some stiff competition from the West Coast including National Champion, Robert Krider and his teammate, Keith Kramer of Double Nickel Nine, as well as my good friend Carlos Valenzuela and Steve Peterson of Team Beans and Dog Racing.

These Guys Mean Business!
During practice on the first day, with the help of my Crew Chief, Andrew, I made changes to the car after every session. I did not run my transponder for the first two sessions of five, but I did run it for the third, fourth and fifth sessions. During the third session, I was about 1.5 seconds off of the leader, Robert Krider with a best lap time of 1:46.882 vs. his 1:45.338.

Results from Session 3 Practice
By the end of the day, Krider had improved by ~0.3 seconds relative to my times. This suggests my competitor was able to make a significant change to the car's performance or to his driving style which would make my job harder for the weekend. Regardless, this analysis prepares one to look for more time in more places-- i.e. work harder.

For the first qualifying session, Team Beans and Dog switched drivers from Steve to Carlos and laid down a flyer. Of note, additionally, was the overall drop in lap times for all competitors, suggesting that the track was "getting faster," providing more grip for drivers. This is due to cloud cover, ambient temperature, and humidity per experience.

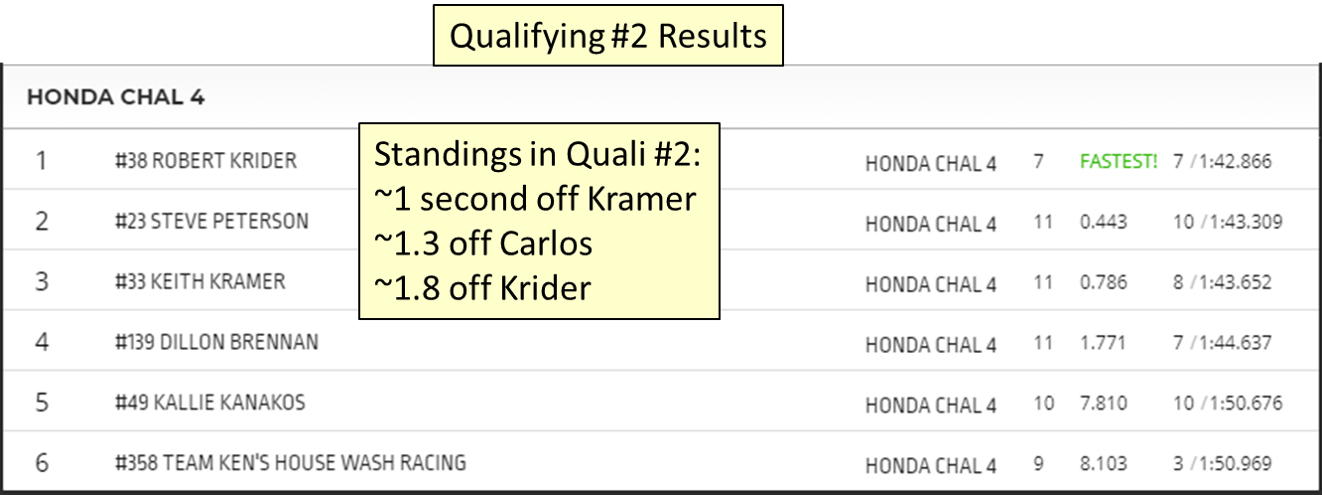
As the day went on, track conditions became further quick as suggested by another overall drop in lap times. While I wasn't gaining significant ground on the leader for qualifying, I was maintaining a steady deficit utilizing car changes to keep up with a stacked racing team. In Qualifying #2, again, I was in 4th, but the results were slightly different, running my fastest lap thus far.
Race Analysis
There were two races during the Championship Weekend-- one was a qualifying race and one was the main event for the podium.

Standing in 3rd on the Podium Against Reigning National Champ team Double Nickel Nine
During a race, the fastest lap time matters, but what matters more? The sum of the following matters more:
1.) Traffic management
Managing faster or slower, out-of-class cars passing without significant loss in speed/position are facets of good traffic management.
2.) A good start
Avoiding jumping the start which would result in disqualification, having impeccable reaction time when the flag drops, and deciding when to pass or bump help for a good start.
3.) Car/driver consistency
If the driver cannot maintain their level of performance throughout a race due to a lack of cardio or mental conditioning, they will fall off in speed. If the car is not set up to make the tires "happy," the car will fall off in speed. A combination of the two is key.
4.) Flag management
You can be leading a 45-minute race for the entire time. But if you pass just once under a yellow, you will be disqualified.
5.) Defense
How to stop a faster in-class car from getting around you.
6.) Offense
How to pass an in-class car from behind and make it stick.
RaceHero can be used to measure all of these things-- whether one at a time, or collectively. For example, a good start would be suggested in part by a good lap time for the first lap relative to competitors or a large gain in position. Car/driver consistency can be gauged by a drop or lack thereof in lap times over the course of the race. A defending driver may maintain position in front of an in-class car with a faster best lap time.

Photo of #ChelseaTheCivic Leaving the Keyhole at Mid-O (Photo by Herb Lopez of @DriveNASA
For race analysis, I typically take all of the RaceHero data I can get for my competitors and put it into an Excel Sheet like a true engineer would. Below you will see that I copied all lap times from RaceHero, converted them to total seconds to make it easier for Excel to analyze, then I measured standard deviation of hot, green laps (not first or last lap...no standing yellow laps) and put it in a table:

Getting my Data Nerd on
For the first lap, it's clear that I had a very good start. I decided to bump Kramer whose start was not as good to keep Steve on my inside while Ken had the best start of all of us, getting the jump on Keith, Steve, and myself to second place.
However, leading into China Beach, Ken was passed back by both Keith and I with Steve still in tow of Ken. The rest of the first lap was a game of traffic management. All of these factors lead me to the second-fastest first lap time. However, with nearly a 20-HP deficit to my competitor Krider, a better time would have been difficult to achieve:

Starting Lap Times
Next, we'll look at the beginning laps of the race. In the beginning laps of the race, it's important to play offense, attempting passes on your competitors while the tires are still fresh. It's also important to get by slower out-of-class traffic as quickly as possible. During this portion of the race, heart rate and adrenal release should be highest.

Photo by Herb Lopez of @DriveNASA
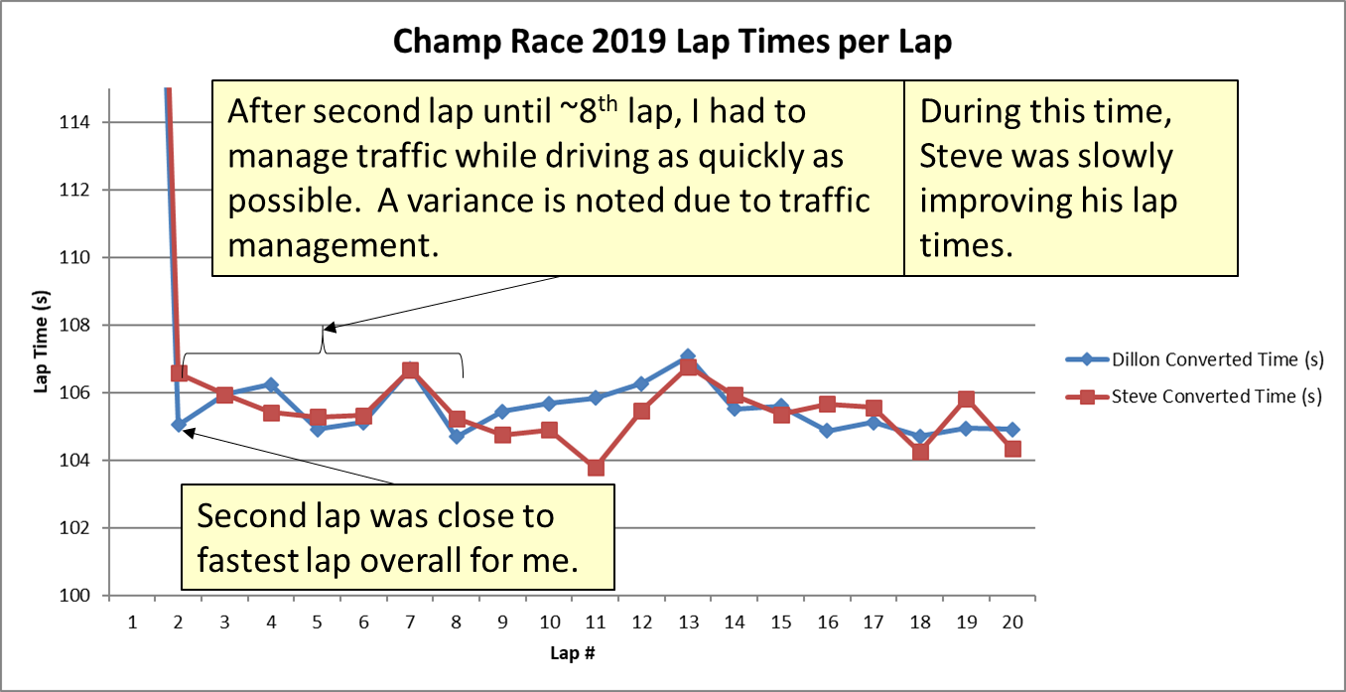
Below you'll see a graph of overall lap time in seconds vs lap # for Steve, P4 and myself, P3. For the first half of the race I laid down a killer start and close to the fastest lap I could for my second lap. After that, variation in lap time was caused by out-of-class traffic. However my good start allowed me to maintain a comfortable lead:
Analysis of Race Start
In the middle of the race, I try to conserve my tires as best as possible so I can lay down flyers at the end of the race. This is also clearly noticeable in the next graph I'll show below. What's important to remember is while you're saving your tires, your competitor in the spot behind you may be catching up. This was exactly the case as Steve, in his lightweight CRX began to close the gap:

Mid-Race Analysis
By the end of the race, one may note that Steve and I were running very close times. Keen eyes will also observe that Steve's fastest overall lap time was somewhere near 1 second faster than my fastest overall lap time, suggesting this driver/car combo had more speed than I. This makes sense because by the end of the race I was driving as defensively as I could within racing rules. It's important to avoid blocking or other foul play when employing proper defense, but it's also important to maintain position, obviously.

End-of-Race Analysis
Driver and car consistency among the pack will lastly be analyzed. To do this, we look at standard deviation and average lap time per competitor. Any laps with yellow flags, red flags, restarts, and aborted starts are thrown out. Additionally, we do not consider starting and finishing lap from RaceHero when calculating these statistics.
Since this is averaged over the entire race, this heavily favors analysis of driver consistency over car consistency. Car consistency is better analyzed in segments as shown above. However, car consistency is a variable feeding into this analysis.

Overall Race and Consistency Analysis
As shown above, Steve and I had the best consistency over the course of the race (+/- 0.80 and +/- 0.69, respectively). We had an awesome, clean battle that ended up with me in P3 and Steve in P4. The race video is here:
Champ Race Highlights
Thanks for the read, all. Looking forward to my next blog post.